Analytics for business & research
Turn your data into decisions you can explain.
Analytivio provides data analytics services for businesses and researchers who need clear answers from spreadsheets, operational records and research datasets. Get support with data cleaning, statistical analysis, dashboards and forecasting, with the approach matched to your question.
Whether you need a focused analysis, a statistical model or an interactive dashboard, start with the question you want to answer.
Discuss your projectExplore our services ↓
Explore our data analytics services
Explore six services that take you from raw data to understandable findings.
Business Data Analysis
Investigate sales, customers and operations to understand performance and identify questions worth acting on.
Explore business analysis →Statistical Modeling
Explore relationships and test hypotheses with methods selected for your question and the structure of your data.
Explore statistical modeling →Data Visualization Services
Make findings easier to understand through clear charts, reports and dashboards built around the information your audience needs.
Explore data visualization →Predictive Analytics
Use historical patterns to explore likely outcomes. Understand the assumptions and uncertainty behind a forecast before using it.
Explore predictive analytics →Research & Academic Data Help
Get support with research datasets, analytical methods and interpretation so you can understand and explain your findings.
Explore research support →Data Cleaning & Processing
Resolve inconsistent formats, duplicates and missing information, and prepare a structured dataset for analysis.
Explore data preparation →A clear path from question to insight
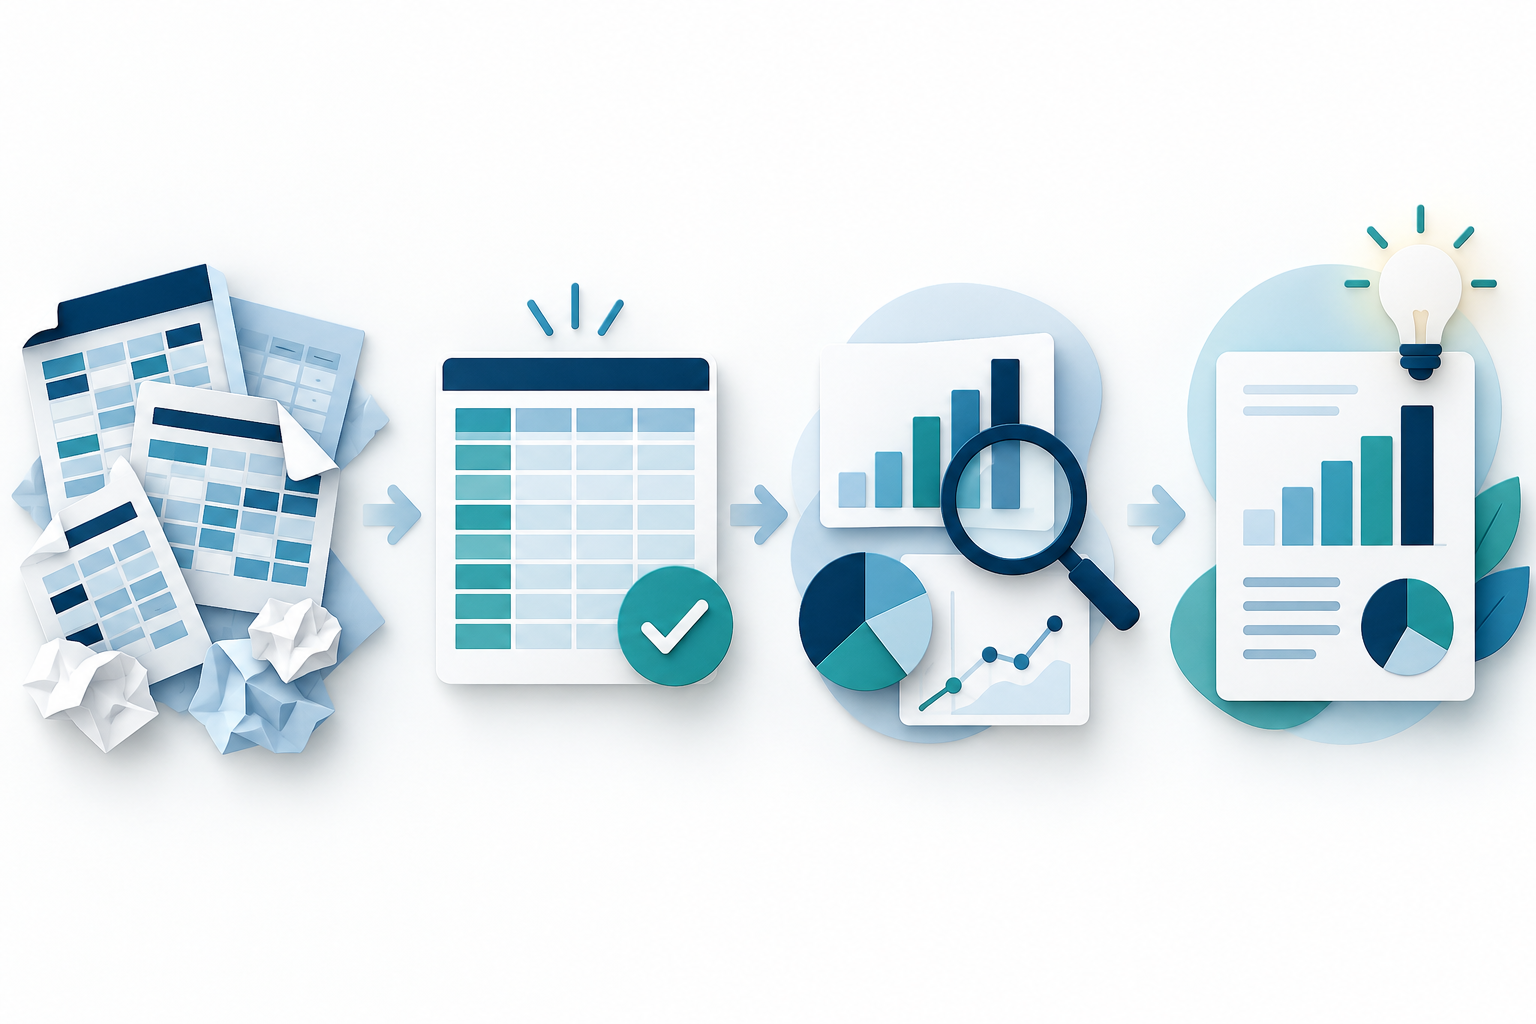
- 01. Define the questionDescribe your objective, available data and the decision or research question you need to address.
- 02. Agree the approachDiscuss the scope, methods, deliverables and timing before the analysis begins.
- 03. Prepare & analyseReview data quality, apply appropriate methods and examine the reliability of the findings.
- 04. Understand the resultsReview the findings, their limitations and the next steps relevant to your project.
Outputs that fit your project
Depending on the agreed scope, your project may include a prepared dataset, analytical report, visualizations, dashboard or documented code. We can discuss tools such as Excel, SQL, Python, R, Power BI, Tableau and SPSS to suit your team’s needs.
Explore analytics solutions for your field →Match your business question to the right analysis
Data analytics services combine preparation, exploration, modeling and interpretation. The useful starting point is the decision you need to make. These illustrative examples show how a brief can become a defined project; they are not client case studies or promised results.
Sales and customer performance
Question: Revenue is rising, but which products and customers contribute to margin?
Data: Order lines, discounts, returns, costs and customer identifiers.
Possible output: A profitability breakdown by product or segment, with definitions that make revenue and margin comparable.
Dashboard and reporting
Question: Why do teams report different totals for the same KPI?
Data: Source exports, existing reports and business rules.
Possible output: Agreed KPI definitions, reconciled totals and a Power BI or Tableau dashboard with useful filters.
Research and survey analysis
Question: Do the observed group differences support the research hypothesis?
Data: An anonymized dataset, questionnaire, coding guide and research objectives.
Possible output: Appropriate statistical tests, assumption checks and an interpretation that distinguishes evidence from uncertainty.
For a more specific starting point, explore marketing analytics, financial data analysis, HR analytics or academic research support.
What should your analytics project deliver?
Agree the outputs before work starts. A dashboard, a statistical report and a forecasting model solve different problems. Depending on the scope, ask for:
- Prepared data: A structured dataset with a record of important cleaning decisions, variable definitions and unresolved quality issues.
- Findings and interpretation: A concise answer to the original question, supporting charts or tables, and an explanation of limitations.
- Dashboard handover: KPI definitions, source mapping and instructions for the agreed refresh and filtering workflow.
- Model evaluation: Relevant error metrics or validation results, assumptions and an explanation of where predictions may be unreliable.
- Reproducible analysis: Annotated code or documented steps where included, so the result can be checked or repeated.
A useful acceptance check is simple: can the intended reader identify the finding, understand how it was reached and decide what to do next?
Excel, SQL, Python, R, SPSS, Power BI or Tableau?
The tool should fit your data, analytical method and handover needs. Start with your team’s existing environment rather than selecting software solely because it is popular.
- Excel and SQL: Useful for structured records, reconciliation, extracting relevant data and spreadsheet-based reporting.
- Python and R: Suitable for repeatable data preparation, statistical modeling and forecasting workflows.
- SPSS: A familiar option for statistical analysis in survey and academic projects.
- Power BI and Tableau: Useful when people need to explore KPIs through interactive dashboards.
Tell us about required file formats, software availability and who will maintain the work after delivery. Licensing and refresh requirements should be clarified in the scope.
What affects the cost and timeline?
Data analytics pricing depends on more than the number of rows. A small dataset with unclear definitions can take more preparation than a larger, consistent export. A meaningful proposal considers:
- How many data sources need to be joined and whether reliable matching keys exist.
- The amount of cleaning, missing information and manual reconciliation required.
- The number of research questions, dashboards, models or reporting views.
- Validation, documentation, presentation and revision requirements.
- The deadline and whether the work is one-off or recurring.
For an initial discussion, prepare a short objective, column names or an anonymized sample, approximate data size, preferred output and deadline. Discuss an appropriate transfer method before sharing confidential records.
Choosing a data analytics partner
Look for a clear method, understandable deliverables and an honest explanation of what the data can support. Ask how missing values will be handled, how a model will be validated, and whether limitations will be documented. Correlation alone does not establish causation, and a model that fits historical data closely may still perform poorly on new observations.
Analytivio combines business analysis, statistical modeling and research support. Learn about Analytivio and discuss the expertise and deliverables your particular project needs.
Data analytics services: frequently asked questions
What is the difference between data analysis and data analytics?
Data analysis usually refers to examining data to answer a specific question. Data analytics is often used more broadly to include preparation, reporting, forecasting and the processes that support repeated decisions. Providers use the terms differently, so compare the actual scope and outputs.
Can analysis start with messy or incomplete data?
Yes, with a data-quality review first. Missing values, inconsistent units and duplicates can change the findings. Some issues can be corrected; others limit which questions can be answered. Agree how those limitations will be handled before modeling.
Does research support guarantee significant results?
No. Statistical analysis evaluates the evidence in the data; it cannot promise a preferred result. Research support should explain assumptions, effect sizes and uncertainty, and help you understand your own findings.
Do I need a dashboard or a one-off report?
A report is useful for a defined question or a fixed research dataset. A dashboard is more suitable when a team needs to revisit the same metrics, apply filters and refresh data. Consider who will use it and maintain it before choosing.
Which service should I choose?
Start with your goal. Understanding performance points towards business analysis; testing a research question towards statistical support; presenting results towards visualization. If your data needs preparation first, discuss data cleaning as part of the scope.
What should I share in the first conversation?
Describe your objective, the type and approximate size of your dataset, your preferred output and any deadline. Agree a suitable data-sharing method before sending confidential records.
Can you help with a one-off question?
Yes. The business analysis service covers focused analytical questions as well as broader projects. Tell us what you need to establish so we can discuss a suitable scope.
How are cost and timing determined?
They depend on data quality, complexity and the agreed deliverables. Contact us to discuss your requirements and request a project proposal.
Let’s start with your question
What do you need your data to tell you?
Tell us about your business or research challenge. We will help you identify the right analytical starting point.
Chat on WhatsApp →
