🎧 24×7 Support
Turn Complex Data Into Clear, Actionable Insights
Every day, your business generates data sales numbers, customer behavior, operational metrics, marketing performance. But raw data sitting in spreadsheets and databases doesn’t drive decisions. Analytivio’s data visualization services transform that data into interactive dashboards, real-time reports, and visual stories that your team can actually use without needing a data science degree to understand them.
We design and build custom data visualization solutions that help organizations spot trends faster, communicate insights clearly across teams, and make confident, data-backed decisions. Whether you need a single executive dashboard or an enterprise-wide business intelligence system, our data visualization consultants build it to fit your exact workflow.
🎧 24×7 Support
Why Data Visualization Matters for Your Business
• Faster decision-making — Visual data is processed by the brain far faster than tables of numbers, so teams identify problems and opportunities in seconds, not hours.
• Better cross-team communication — Dashboards give sales, marketing, finance, and leadership a shared, single source of truth.
• Early trend and anomaly detection — Interactive charts surface outliers and patterns that get buried in raw spreadsheets.
• Improved forecasting and planning — Visualized historical data makes predictive and trend analysis more reliable.
• Higher stakeholder trust — Clean, well-designed reports make your data (and your business) look credible and in control.
🎧 24×7 Support
Industries We Serve
With extensive industry experience and a team of skilled professionals, we provide tailored, high-quality services to clients across diverse sectors, including retail, corporate and business organizations, marketing agencies, healthcare, education, research institutions, professional services, and other specialized industries, ensuring that every solution is aligned with the specific requirements, standards, and objectives of each sector.
E-commerce & Retai
Sales trends, inventory, customer behavior dashboards
Healthcare
Patient outcomes, operational efficiency reporting
Finance & Banking
Risk analysis, portfolio performance visualization
Manufacturing production metrics, supply chain visibility
SaaS & Technology
Product usage analytics, churn and retention dashboards
And so on….

Business Intelligence (BI) Dashboard Integration
We connect your existing data sources CRM, ERP, e-commerce platforms, marketing tools, databases into unified BI dashboards using Power BI, Tableau, and Qlik, giving you one clear view of your entire business.
Data Storytelling & Visual Reporting
Not sure where to start? Our consultants audit your current reporting setup and design a data visualization strategy aligned with your business goals, tech stack, and budget.
Real-Time Data Visualization
Transform complex and continuously updated data into clear, interactive dashboards and visual reports, enabling businesses and professionals to monitor key performance indicators, identify trends, track operational changes, and make faster, data-driven decisions with greater accuracy.
Data Visualization Consulting & Strategy
Our experienced data visualization consultants develop customized strategies that transform complex datasets into clear, meaningful, and decision-focused visual insights, helping organizations select the right visualization tools, design effective dashboards, define relevant KPIs, streamline reporting processes, and build data-driven solutions aligned with their business objectives.
Tools & Technologies We Work With
| Category | Tools |
|---|---|
| BI Platforms | Power BI, Tableau, Qlik Sense, Looker Studio |
| Programming & Custom Viz | Python (Matplotlib, Seaborn, Plotly), D3.js, R |
| Data Warehousing | Snowflake, BigQuery, Amazon Redshift |
| Databases & ETL | SQL Server, PostgreSQL, MySQL, Azure Data Factory |
| Cloud Integration | AWS, Microsoft Azure, Google Cloud Platform |

about us
Why Choose Analytivio for Data Visualization
• Custom-built, not template-based —every dashboard is designed around your actual business questions.
• End-to-end service from data cleaning and integration to final dashboard delivery and team training.
• Cross-platform expertise — we’re not locked into one tool; we recommend and build on whatever fits your stack best.
• Fast turnaround — most standard dashboard projects go live within 2–4 weeks.
• Ongoing support — we don’t disappear after launch; we maintain, update, and scale dashboards as your data grows.
Our Process
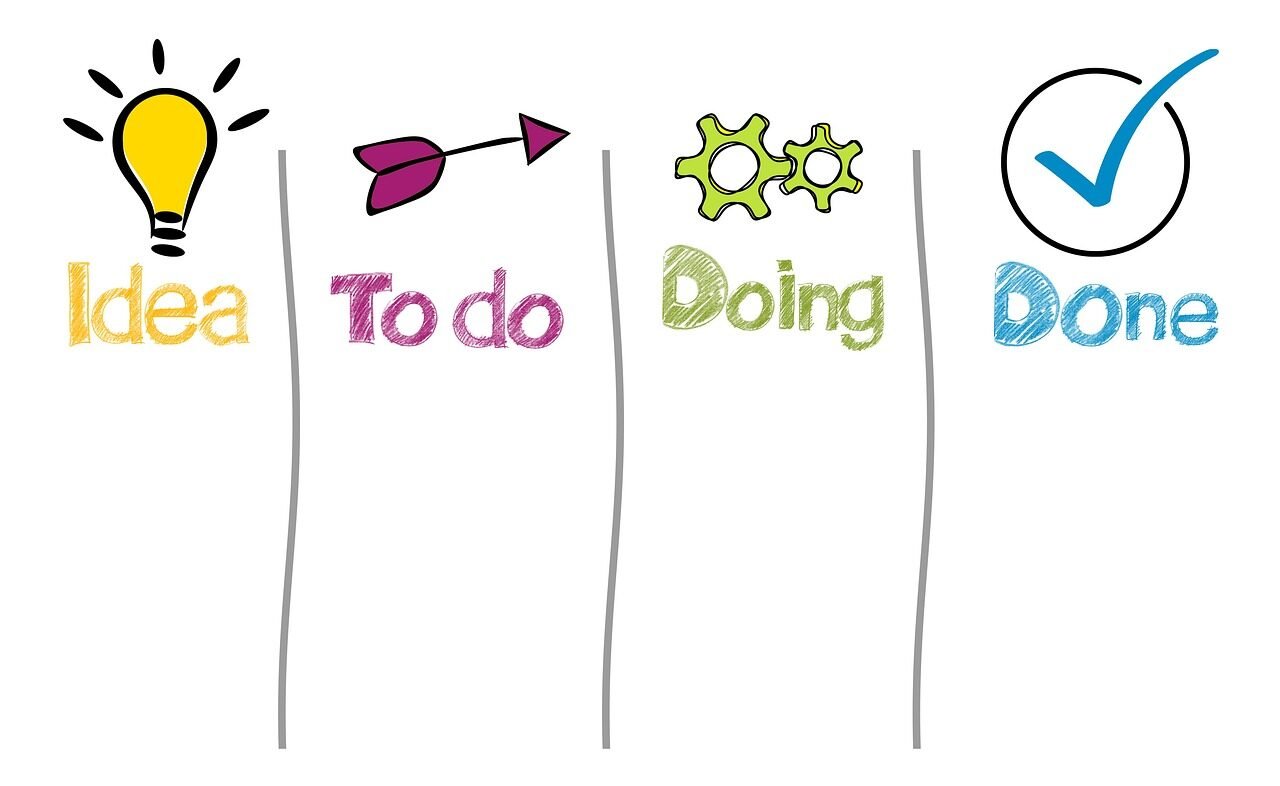
• Discovery & Data Audit — We review your existing data sources, tools, and reporting gaps.
• Strategy & KPI Mapping — We define which metrics matter most for your goals and audience.
• Design & Prototyping — We build wireframes and interactive prototypes for your review.
• Development & Integration — We connect live data sources and build the full dashboard.
•Testing & Training — We test for accuracy and train your team to use and adapt the dashboard
• Support & Optimization — We provide ongoing maintenance and iterate as your needs evolve.

